In the realm of health and fitness, understanding body composition has become increasingly important, with body fat percentage standing out as a critical metric. Unlike the simplistic measure of weight or even the Body Mass Index (BMI), body fat percentage offers a more nuanced view of one's physical condition, distinguishing between fat mass and lean body mass. This distinction is vital because it acknowledges that not all weight is created equal; muscle tissue, for instance, is denser and metabolically more active than fat tissue. Consequently, two individuals with identical weights and heights can have vastly different body compositions and, therefore, different health profiles. The pursuit of a healthy body fat percentage is not merely an aesthetic endeavor but a cornerstone of metabolic health, influencing everything from hormone regulation to risk factors for chronic diseases.
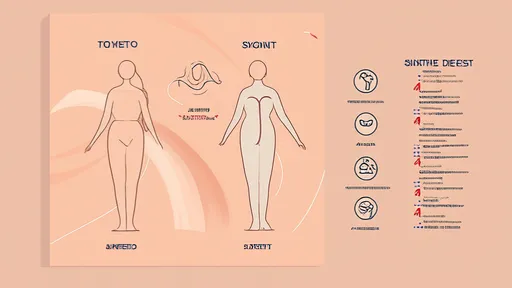
For the general public, the concept of body fat percentage can often seem abstract and difficult to visualize. This is where body fat percentage visual comparison charts come into play. These tools are designed to bridge the gap between a numerical value and a tangible physical reality. They typically consist of a series of images or illustrations depicting individuals—often categorized by sex—with varying levels of body fat. Each image is paired with its corresponding percentage range, providing a immediate, visual reference point. A person might look at an image labeled "20% body fat (female)" and see a physique with defined curves and some visible muscle outline, particularly in the abdominal area. Another image for "30% body fat" might show a softer, less defined physique. This visual aid is powerful because it allows for a quick, albeit subjective, self-assessment. It answers the common question: "What does 15% or 25% body fat actually look like on a person like me?"
However, the utility of these visual charts is heavily tempered by their inherent limitations. The most significant drawback is their subjectivity. Body fat distribution is highly individual, influenced by genetics, age, and hormone levels. Two women with a body fat percentage of 25% may carry that fat in completely different patterns—one might have it predominantly on her hips and thighs (a gynoid pattern), while another might carry more around her abdomen (an android pattern). A static image cannot possibly account for this vast diversity. Furthermore, these charts often feature models with idealistic body types and muscle tone, which can set unrealistic expectations and lead to inaccurate comparisons. Relying solely on a visual guide for such a precise measurement is akin to diagnosing an engine problem by merely listening to it; you might get a general idea, but you'll miss the crucial details.
This leads us to the undeniable necessity of scientific measurement methods. To move beyond estimation and into the realm of accurate data, several proven techniques have been developed. These methods vary widely in terms of complexity, cost, accessibility, and precision. Understanding this spectrum is key for anyone serious about tracking their body composition reliably over time.
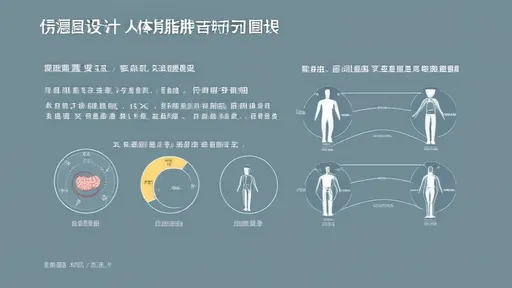
Often considered the gold standard in body composition analysis, Dual-Energy X-ray Absorptiometry (DEXA) is a medical-grade scan that provides an incredibly detailed breakdown. It doesn't just give a total body fat percentage; it can differentiate between visceral fat (the dangerous fat surrounding organs) and subcutaneous fat (the fat under the skin), and also measure bone density and lean mass distribution. The procedure is non-invasive and involves lying still on a table while a scanner passes over the body. Its precision is unmatched by most other methods available to the public. However, this accuracy comes with significant drawbacks: it requires specialized, expensive equipment usually found only in hospitals, research labs, or high-end sports medicine facilities, and it involves a low dose of radiation, making it impractical for frequent use.
Another highly accurate method is Hydrostatic Weighing, also known as underwater weighing. This technique is based on Archimedes' principle, which states that the upward buoyant force on a submerged object is equal to the weight of the fluid it displaces. Since fat is less dense than water and muscle and bone are denser, a person with more body fat will weigh less underwater relative to their land weight. By measuring a person's weight on land and their weight submerged in a water tank, technicians can calculate body density and from that, derive body fat percentage. While exceptionally accurate when performed correctly, the process is cumbersome, requires special equipment (a water tank), and can be uncomfortable for the subject, who must exhale all air from their lungs while submerged.
A more modern and increasingly popular technique is Bioelectrical Impedance Analysis (BIA). This method is the technology behind many modern consumer bathroom scales and handheld devices. It works by sending a very low, harmless electrical current through the body. The current flows more easily through tissues that contain mostly water, like muscle, and encounters resistance (impedance) when passing through fat. The device uses this impedance value, along with user-inputted data like height, weight, age, and sex, to estimate body fat percentage. The primary advantages of BIA are its convenience, affordability, and the ability to use it at home. The major disadvantage is its vulnerability to hydration status. Because it measures electrical flow through water, results can fluctuate significantly based on how much water you've had to drink, when you last exercised, or even the time of day. For consistent results, measurements must be taken under highly controlled conditions.
A simple, low-tech, yet surprisingly effective method is the use of Skinfold Calipers. This technique involves pinching the skin and subcutaneous fat at specific standardized locations on the body (e.g., abdomen, thigh, triceps) and measuring the thickness of these folds with the calipers. These measurements are then plugged into validated equations to estimate overall body density and fat percentage. The accuracy of this method is almost entirely dependent on the skill and experience of the person taking the measurements. A well-trained professional can achieve results that are very close to those from more advanced methods. It is cost-effective and portable but suffers from inter-tester variability (different measurers may get different results) and can be less accurate for individuals who are very obese or very lean.
So, how does one navigate this landscape of tools? The key is to understand the purpose of the measurement. For a general health enthusiast looking to track broad trends over months, a consistent BIA protocol (e.g., using the same scale first thing in the morning after hydration) or periodic skinfold measurements with a qualified trainer could be perfectly sufficient. The focus should be on the trend line—is the percentage moving in the desired direction over time?—rather than obsessing over the absolute number. For an athlete or individual requiring precise data for medical or performance reasons, investing in a DEXA scan once or twice a year provides a solid, accurate baseline against which to compare more frequent but less precise methods.
Ultimately, the journey to understanding your body composition is a personal one. Visual charts serve as an excellent entry point, demystifying the numbers and providing motivational context. They answer the "what" and the "why." But for the "how much," science is indispensable. By marrying the intuitive understanding gained from visual aids with the objective data provided by scientific methods, individuals can craft a informed, effective, and healthy approach to managing their body composition. This holistic strategy empowers people to make decisions based not on guesswork or appearance alone, but on a true understanding of their physical selves, leading to more sustainable health and fitness outcomes.

By /Aug 25, 2025

By /Aug 25, 2025

By /Aug 25, 2025

By /Aug 25, 2025

By /Aug 25, 2025

By /Aug 25, 2025
By /Aug 25, 2025

By /Aug 25, 2025

By /Aug 25, 2025

By /Aug 25, 2025

By /Aug 25, 2025

By /Aug 25, 2025

By /Aug 25, 2025

By /Aug 25, 2025

By /Aug 25, 2025
By /Aug 25, 2025

By /Aug 25, 2025

By /Aug 25, 2025

By /Aug 25, 2025
By /Aug 25, 2025